Your NPS Score Says Nothing Until Someone Explains It Out Loud
A 21-firm study failed to back NPS as the one number you need. The score needs its reason. How to design the NPS follow-up question, and when voice helps.
The short version
- NPS was sold in 2003 as 'the one number you need to grow', but its author also told companies to ask a follow-up: 'What is the primary reason for your score?'
- The score alone is weak evidence. A 2007 Journal of Marketing study of 21 firms and 15,500-plus interviews failed to replicate NPS's claimed superiority over other loyalty measures.
- Even a supportive 2022 study, with 193,220 NPS evaluations, found NPS levels uncorrelated with sales growth. Only changes in NPS, measured across all potential customers, predicted next-quarter growth.
- Ask the why straight after the score and let people speak or type it. Voice answers run about 2.5 times longer, but voice-only questions lose about half their starters, so keep a text box.
Fred Reichheld never asked for only one number. His 2003 Harvard Business Review article sold the Net Promoter Score as "The One Number You Need to Grow". Yet he also told companies to ask a second question: what is the primary reason for your score? That NPS follow-up question is where the useful information lives. A 2007 study of 21 firms and over 15,500 interviews could not even confirm the score's claimed edge on its own.
A 0 to 10 answer is a headline. The reason is the story. This post covers what the research says about NPS and why the reason matters more than the number. Then it shows how to design the follow-up so customers answer it, including when to let them say it out loud.
The best NPS follow-up question is the one NPS's creator recommended: "What is the primary reason for your score?" Ask it straight after the 0 to 10 question, keep it optional, and let people answer by voice or text. Voice gets longer, more specific reasons; the text option keeps the people who cannot talk aloud.
The follow-up was in the design from the start
The NPS story usually gets told as a story about one number. The original material tells a slightly different one.
The 2003 article sold simplicity
Reichheld's article opens at a loyalty forum with CEOs from Vanguard, Chick-fil-A and State Farm. They are listening to Andy Taylor, CEO of Enterprise Rent-A-Car (HBR, December 2003). The argument that followed was that one question about recommending a company predicts growth better than long satisfaction questionnaires. The title promised one number, and that is the part executives remembered.
Reichheld asked for the reason too
In the later book, Reichheld and Rob Markey describe the method in full. The question is typically phrased as: on a zero to ten scale, how likely is it that you would recommend us to a friend or colleague? Then they add: "I also instructed companies to ask at least one follow-up question: What is the primary reason for your score?"
They explain why in the same passage. The open follow-up lets companies "hear the reasons for these attitudes in the customers' own words", without the preset categories of a traditional questionnaire (Bain excerpt, 2011). Customers scoring 9 or 10 are promoters, 7 or 8 passives, and 0 to 6 detractors. The score is promoters minus detractors.
We think the industry kept the wrong half. The score fits on a dashboard, so it survived. The reason takes effort to read, so it shrank into an optional comment box most people skip.
What the research says about the score on its own
NPS has been studied hard by academics, and the results are mixed at best. The criticism matters here because it changes what the follow-up is for. If the number were a reliable growth predictor on its own, the why would be a nice extra. It is not.
The first big replication failed
Keiningham, Cooil, Andreassen and Aksoy tested Reichheld's claims with longitudinal data from 21 firms and more than 15,500 interviews. Using the very industries Reichheld had cited as examples, their research "fails to replicate his assertions regarding the 'clear superiority' of Net Promoter compared with other measures".
The best defence of NPS is narrower than the original claim
A 2022 study by Baehre, O'Dwyer, O'Malley and Lee is the strongest recent case for NPS, and it is still a qualified one. They analysed 193,220 NPS evaluations from 38,644 people across 7 sportswear brands. Static NPS levels showed no correlation with current or future sales growth.
What did predict growth was change in NPS from one quarter to the next, and only when NPS was measured across all potential customers, not just current ones. Even then, adding NPS improved the model's fit only slightly, by 0.028. The authors conclude that the original premise is reasonable, and that academics' methodological concerns are valid too.
Critics say the score displaced better research
Fisher and Kordupleski go further. Their review in Applied Stochastic Models in Business and Industry says NPS "has not lived up to its claimed benefits". Concerns raised across this literature include the cut-offs at 6 and 9, which throw away information, and the reliance on correlations with past growth.
| What people expect from NPS | What the evidence says | Our verdict |
|---|---|---|
| The single best predictor of growth | Not replicated across 21 firms (2007) | Do not bet a strategy on it |
| A high score means healthy growth | Levels uncorrelated with sales growth (2022) | Watch changes, not levels |
| It tells you what to fix | The number contains no reasons | Only the follow-up does this |
| A simple, comparable trend over time | Changes predicted next-quarter sales, modestly (2022) | This is where NPS earns its place |
| Short enough that people finish it | One tap is cheaper than any questionnaire | NPS wins here, and it matters |
The last two rows are real strengths. Baehre and colleagues also report a meta-analysis finding that simple top-box measures often outperform complex indices. A short, trackable signal is worth having. It just cannot explain itself.
Why the "why" should be spoken
If the reason is the valuable half, the next question is how to collect good reasons. The typed comment box is the default, and it usually returns a few words. People edit when they type. They explain when they talk.
The best evidence is a randomised smartphone experiment by Höhne, Gavras and Claassen. Spoken answers averaged 54.7 words against 21.5 typed, and covered more topics. We break that study down in our analysis of voice survey answers, so we will not repeat it here.
For NPS, length is not the only gain. A detractor who says "it's fine, I guess" and pauses tells you something a typed "fine" cannot. Research on vocal emotion supports the idea that tone carries information listeners can decode; we summarise it in our voice of customer survey guide. We would not claim tone is more useful than words for every NPS programme. We do think a team that hears 20 detractors will act faster than one reading a tagged spreadsheet.
How to design the NPS follow-up question
A good follow-up is short, immediate and optional. Here is the sequence we would use for any NPS survey that adds a spoken reason.
- 1Ask the recommend question firstOn a 0 to 10 scale, how likely are you to recommend us to a friend or colleague? Required, one tap.
- 2Ask the reason on the next screen"What is the main reason for your score?" While the score is fresh, the reason is easy to give.
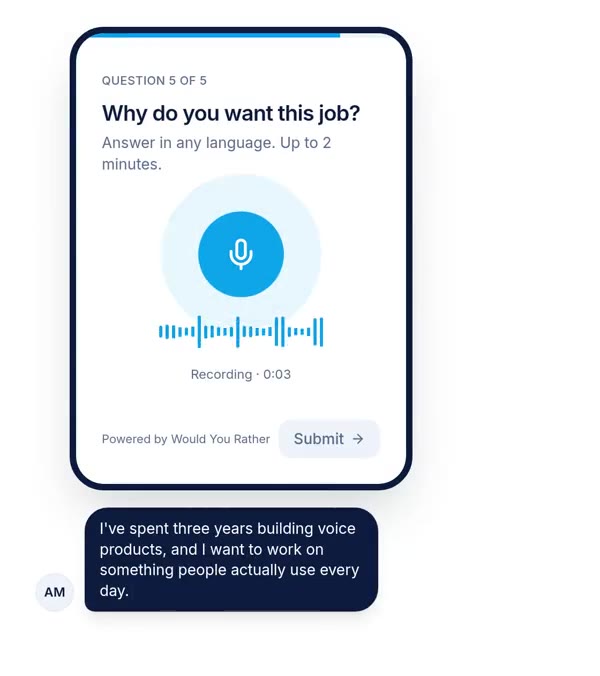
- 3Offer a microphone and a text boxState the limit in the question: "Say it or type it. Up to 1 minute." Keep the answer optional.
- 4Tailor the wording by score band, if you can branchRoute detractors, passives and promoters to slightly different prompts. One question each, never a second open box.
- 5Stop there, or ask one tap moreA plan or segment question helps slicing later. Anything longer belongs in an interview.
- 6Listen before you tagPlay 20 to 30 answers end to end, write themes, then tag the rest against them by score band.
Ask one question, immediately
The reason decays fast. Ask it on the screen right after the score, not at the end of a long survey. One follow-up is enough. A second open question mostly collects repeats of the first, and every extra screen costs completions.
Tailor the wording by score band
The generic question works for everyone. Banded wording gets more specific answers, because it tells people what kind of story you want.
| Score band | Follow-up wording | What to listen for |
|---|---|---|
| Detractors (0 to 6) | "What went wrong, or what is missing?" | The specific moment it failed, and whether they have already left |
| Passives (7 to 8) | "What would make this a 10 for you?" | The one gap between fine and loyal |
| Promoters (9 to 10) | "What would you tell a friend about us?" | The words customers use, which belong on your homepage |
| Anyone | "What is the main reason for your score?" | The default when you cannot branch |
Our view on passives is that they are the most underused band. Detractors get attention because they hurt, and promoters because they flatter. Passives are often one fix away from recommending you, and they will tell you which fix.
Make voice optional, never required
Never make the spoken answer the only way to respond. Some people are at work, on a train, or simply prefer writing. A required voice field turns them into drop-offs, and the next section shows how costly that is.
What a spoken why costs you
Here is the honest part. In the Höhne experiment, voice-only respondents left in large numbers. About 51% of people assigned to voice broke off before the questions began, against about 24% for text.
- Broke off before the questions51%
- Stayed, but skipped a given open question17%
- Gave a spoken answer32%
NPS surveys have one advantage over that experiment. The score comes first, so people have already committed before they see the microphone. In the experiment, many voice respondents left as soon as they learned what was coming. We expect an optional voice follow-up after a required score to lose far fewer people. We have not measured that, so treat it as a hypothesis to test on your own survey, not a result. The question-type evidence is collected in our post on form drop-off by question type.
Setting up a spoken NPS follow-up in Would You Rather
A plain note on fit, so you do not discover it halfway through. Our rating field numbers its tiles from 1, up to 11 tiles. It cannot display a standard 0 to 10 scale today. For a strict NPS, use a single choice question with 11 options labelled 0 to 10, or collect the score in your existing NPS tool and use our form only for the spoken why.
The follow-up itself is a voice answer field with a maximum length. The "type instead" fallback is a switch on that field, and it is off by default, so turn it on. To tailor wording by band, put each band's question in its own section and add logic rules that jump to it. Our logic compares exact values rather than ranges, so a detractor rule lists each score from 0 to 6, joined with "or". We explain rules and sections in our guide to conditional logic in forms.
Answers sync to a spreadsheet with an audio link per response, next to the score; see sending form responses to Google Sheets. We do not transcribe recordings or score sentiment. If you need text for tagging, export the audio links and run them through a speech-to-text engine you trust.
Where this argument is weakest
We have argued that the reason matters more than the number. Four parts of that argument rest on thinner evidence than we would like.
First, the voice evidence comes mainly from one German experiment with a paid panel answering sensitive social questions, not NPS. Customers answering about a product after giving a score may talk more, or less. Second, the drop-off in that experiment was for voice-only questions. We have no published data on an optional voice follow-up after an NPS score, so our expectation of lower drop-off is untested.
Third, the NPS critiques cut both ways. Keiningham's study used Norwegian data from a limited number of firms per industry, and Baehre's covers one US industry and young buyers only. Neither settles the question for your market. Fourth, we have not measured whether teams that listen to reasons actually make better decisions than teams that read them. That is a belief we hold, and it is the claim in this post a reasonable reader is most entitled to doubt.
Run it on your next 100 responses
You do not need a new survey. Take the NPS survey you already send and change the comment question in three ways. Move it to the screen right after the score. Reword it to "What is the main reason for your score?", and offer a microphone beside the text box.
Run it until you have 100 responses. Then compare against your last 100: how many people answered the why, and how many words or seconds you got per answer. If both went up, keep it. If answers rose and completions fell, check the order of your questions before you blame the microphone. If you also want to rethink the rest of your customer feedback programme, start with the empty "any other comments" box.
References
- Reichheld, F. F., The One Number You Need to Grow, Harvard Business Review, December 2003. Used for the article's framing and its Enterprise Rent-A-Car opening (opening section only; full text is paywalled).
- Reichheld, F. and Markey, R., The Ultimate Question 2.0, advance excerpt, Bain and Company, 2011. Used for the question wording, the follow-up instruction, and the score bands.
- Keiningham, T. L., Cooil, B., Andreassen, T. W. and Aksoy, L., A Longitudinal Examination of Net Promoter and Firm Revenue Growth, Journal of Marketing, 2007. Used for the failed replication (abstract and its summary in reference 4).
- Baehre, S., O'Dwyer, M., O'Malley, L. and Lee, N., The use of Net Promoter Score (NPS) to predict sales growth: insights from an empirical investigation, Journal of the Academy of Marketing Science, 2022. Used for sample size, levels versus changes, model fit, mean NPS by sample, and the meta-analysis it reports.
- Fisher, N. I. and Kordupleski, R. E., Good and bad market research: A critical review of Net Promoter Score, Applied Stochastic Models in Business and Industry, 2019. Used for the critical review's conclusion (abstract).
- Höhne, J. K., Gavras, K. and Claassen, J., Typing or Speaking? Comparing Text and Voice Answers to Open Questions on Sensitive Topics in Smartphone Surveys, Social Science Computer Review, 2024. Used for answer length, break-off and the per-100 calculation.
The weakest point in this source base: we read the Keiningham and Fisher papers through their abstracts and a later paper's summary, not in full, and the original 2003 article's evidence is behind a paywall.
Questions people ask
What is the best NPS follow-up question?
The standard is the one Fred Reichheld recommended: 'What is the primary reason for your score?'. Ask it immediately after the 0 to 10 question, as an open answer. It works for every score band. If you want more specific answers, tailor the wording by band, for example asking detractors what went wrong and promoters what they would tell a friend. Keep it to one follow-up; a second open question rarely adds much.
Should the NPS follow-up question be required?
No. Make the score required and the follow-up optional. A required open question pushes some people to quit and others to type filler like 'n/a' or 'good'. An optional question gets fewer answers, but the answers you get are real. If you offer a spoken answer, keep a text box beside the microphone, since many people cannot talk aloud where they are.
What is a good NPS score?
There is no universal good score, because NPS varies widely by industry, country and who you survey. A 2022 study found that NPS among current customers averaged about 43 while NPS among all potential customers averaged about minus 3, for the same brands. Compare your score to your own past scores, measured the same way, rather than to published benchmarks.
Why is NPS criticised?
Academic critics argue that the original 2003 evidence relied on correlations with past growth and cross-sectional data. A 2007 Journal of Marketing study of 21 Norwegian firms failed to replicate its claimed superiority over other loyalty measures. Others object to discarding the 7 and 8 scores and to the arbitrary cut-offs. NPS still has a role as a simple trend, but it does not explain itself.
How do you analyse NPS open-ended responses?
Read or listen to a sample first, about 20 to 30 answers, and write down the themes you hear. Then tag every answer with one or two themes and cross them with score bands. The useful output is a short list: the top reasons detractors give, and the top reasons promoters give. Quote real answers in the report, since one customer's words often move a team more than a chart.
Can customers answer NPS surveys by voice?
Yes. A web form with a voice field lets customers tap a microphone in their phone or laptop browser and record their reason, with no app. Spoken answers are longer and carry tone, but voice-only questions lose many respondents. Offer voice as an option next to a text box, state a time limit like 'up to 1 minute', and put the question after the score.
Drafted with AI from published research, then edited and approved by Apoorv Tamrkar.
Would you rather hear the answer?
Make a voice form in a minute. It’s free.
Create a form